The Process Diagram: Rationale and Definition
Hiroaki Kitano, Yukiko Matsuoka, Akira Funahashi, Kanae Oda
The Systems Biology Institute
This document describes rational behind “the process diagram”, and a set of symbols and conventions that are implemented in CellDesignerTM 2.0 and possible extensions for CellDesignerTM 2.5 to be released in 2005.
1 Rationale Behind the Notation
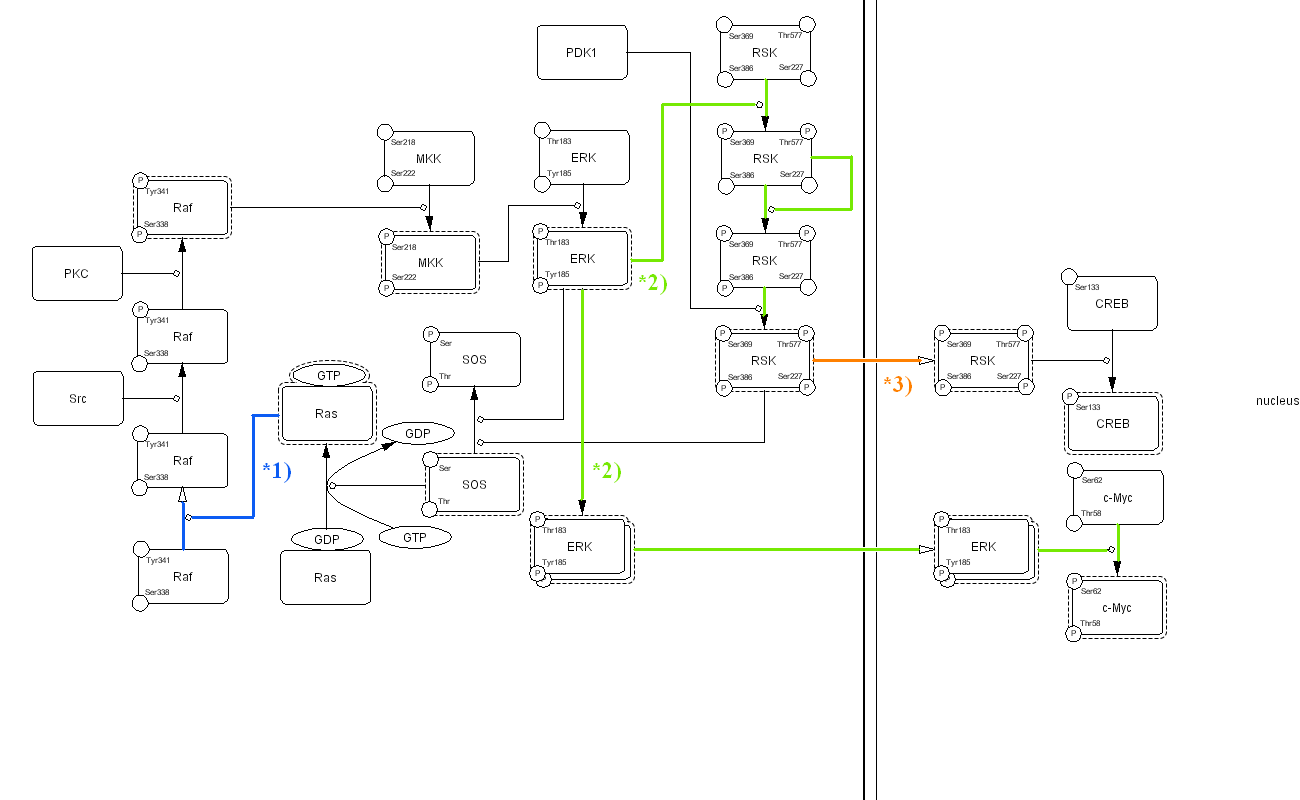
Most diagrams in published papers are drawn using informal notations with sets of arrows, bar-headed lines, and circles roughly representing activation, inhibition, and the proteins involved, respectively. Fig. 1 is a typical example of just such a diagram for a MAPK cascade in a mammalian cell.
Fig. 1. An example of informal arrows-and-bars diagram
>> Check Abbreviations
In this diagram, the arrows may implicate several different reactions. For example, the arrow from Ras to Raf (marked as 1 in Fig. 1) appears to indicate that Ras activates Raf. However, in reality, Ras enhances plasma membrane translocation of Raf. Thus, this arrow is more accurate to be read as “recruitment” or “translocation”, instead of activation. Two arrows originating from ERK to RSK and c-Myc (marked as 2 in Fig. 1) are interpreted as activation of RSK and c-Myc by ERK. However, the same representation could also be interpreted as one complex (ERK) that splits into two subcomponents (RSK and c-Myc). The reason that we exclude this interpretation is because we already know some of the properties of the components involved, not because of anything within the diagram itself. How should we interpret the arrow leading from RSK to RSK (marked as 3 in Fig. 1)? In this case, the arrow is meant to be read as the translocation of RSK from cytosol to nucleus, instead of activation of RSK by RSK itself. Therefore, among these simple examples, there are three possible interpretations of the same arrow symbol; activation, dissociation, and translocation.
Not only are notations used with multiple meanings, the notation is ambiguous and unable to represent essential information (and therefore not machine readable). Correct interpretation depends upon the reader’s foreknowledge. For example, two arrows leading to Raf from PKC and Src indicate the activation of Raf by these two kinases. However, it is unclear what the mechanisms are, which residues are phosphorylated, or which is the first modulator of Raf. Accompanying text can supplement missing information to explain otherwise ambiguous points. However, in some cases the text might be more ambiguous than diagrams.
Kurt Kohn may have been the first to propose well-defined canonical representations for molecular interactions (Kohn 1999; Kohn 2001); and other researchers have been working on alternative representations (Pirson, Fortemaison et al. 2000; Cook, Farley et al. 2001; Maimon and Browning 2001). Unfortunately, none of the proposals has been widely used for a variety reasons. For example, there is no software tool to create a Kohn Map efficiently, and this type of representation does not allow for explicit display of temporal processes. Other notations have different shortcomings.
Circuit schematics used in electronics are ideal examples of information display in a graphical but unambiguous manner. Engineers can reproduce the circuits drawn in the schematics simply from the information contained in the diagram. Although the interactions may be substantially more complex, one of our first goals in systems biology is to create standard graphical notations that unambiguously represent molecular interactions of biological systems.
2 A Process Diagram
A successful graphical notation must: (1) allow representation of diverse biological objects and interactions, (2) be semantically and visually unambiguous, (3) be able to incorporate notations, (4) allow tools to convert a graphically represented model into mathematical formulas for analysis and simulation, and (5) have software support to draw the diagrams. Although several graphical notation systems have been already proposed (Kohn 1999; Pirson, Fortemaison et al. 2000; Cook, Farley et al. 2001; Kohn 2001; Maimon and Browning 2001), each has obstacles to becoming a standard. Kitano proposed a graphical notation for biological networks (Kitano 2003) designed to express sufficient information in clearly visible and unambiguous way. Using the process diagram notation, the molecular interactions shown in Fig. 1 can be graphically represented as shown in Fig. 2.
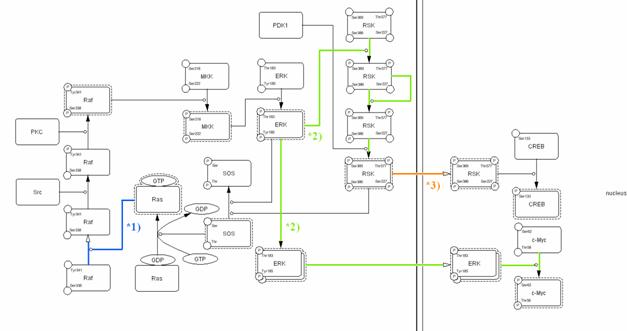
Fig. 2. A process diagram with a consistently defined notation click for bigger image
>> Check Abbreviations
The process diagram is a state transition diagram that represents transition of the state of each molecule using arrows that indicate transition and circle-headed arrows and bar-headed arrows to specify promotion and inhibition of such transitions. The filled arrow (blue) in Fig. 1 is replaced by an open arrow and a circle-headed line in Fig. 2. This indicates translocation of Raf from the cytosol to plasma membrane and the circle-headed line (blue) from Ras to the open arrow indicates that Ras promotes translocation of Raf to plasma membrane, where Raf is full-activated via phosphorylation on both Tyr341 and Ser338 residues by Src and PKC, respectively. Indeed, the interaction of Ras with Raf is generally indicated by an arrow used for activation, but this process is actually the translocation of Raf, which is stimulated by Ras. Each of the two arrows (light green) originating from ERK to RSK and c-Myc in Fig. 1 is represented in a very different way. The arrow heading to RSK is replaced by a circle-headed line which indicates that RSK is phosphorylated by ERK, and subsequently stimulates its auto-phosphorylation. The three filled arrows (light green) between four RSK nodes indicate the state transitions caused by phosphorylation. Each state of phosphorylation can be described sequentially. On the other hand, the pathway from ERK to c-Myc is interpreted as ERK homodimer formation and translocation to the nucleus, where homodimerized ERK activates c-Myc. When the reaction is described in this manner, an interpretation such as “one complex (ERK) split into two subcomponents (RSK and c-Myc)” is impossible. The translocation of RSK from cytosol to nucleus is shown with the open arrow (orange) and can be easily distinguished from state transition or catalysis.
Overall, all reactions are easy to understand at a glance compared with the conventional informal notation. The notation also shows specific characteristics of a protein. For example, readers can quickly recognize that SOS is a guanine nucleotide exchange factor for Ras just by looking at this diagram because sufficient information is presented. We believe that our notation could be a convenient tool to enable researchers to share information involved in molecular interactions with each other.
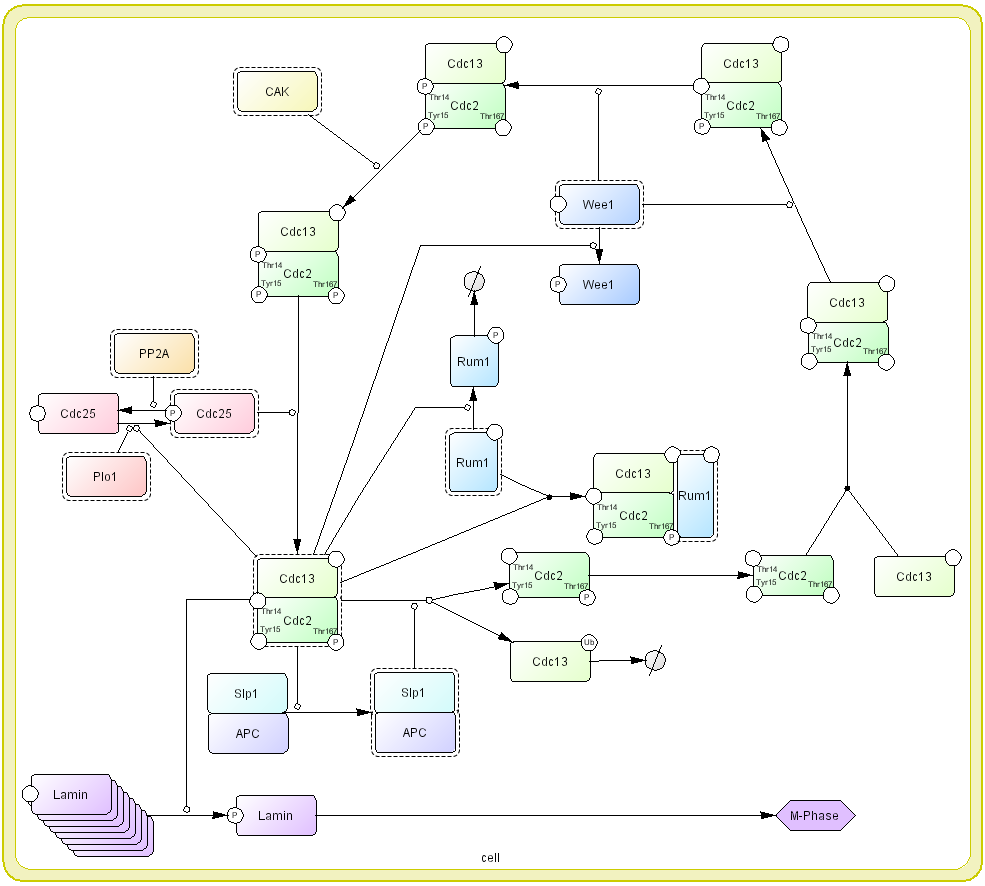
It is important to remind that the process diagram is a state transition diagram. Each node represents state of molecule and complex. Arrow represents state transition among states of molecule. In the conventional diagrams, arrow generally means “activation” or “inhibition” of the molecule. The readers wish to know why “arrows” should be state-transition, instead of activation or inhibition as seen in most informal diagrams. We believe that use the arrows in conventional diagram confuse semantic of the symbol as well as limiting possible molecular processes that can be represented. For example, a process of M-phase promoting factor (MPF), Cdc2 and Cdc13 complex, activation in cell cycle, kinase such as Wee1 phosphorylates Tyr15 and Thr14 residues of Cdc2 that is one of components for MPF (Den Haese, Walworth et al. 1995) (Fig. 3). However, MPF is not yet activated by this phosphorylation. CAK also phosphorylates the other residue, Thr167, but not activate MPF complex. Only when Cdc25 dephosphorylates two Thr15 and Thr14 residues of Cdc2, MPF is activated (Fleig and Gould 1991; Gould, Moreno et al. 1991; Sveiczer, Tyson et al. 2004). If we use “arrow” for activation, only interaction between MPF and Cdc25 can be described. In the process diagram, whether a molecule is “active” or not is represented as a state of the note, instead of “arrow” symbol for activation. Promoting and inhibition of state transition are represented as modifier of state transition using a circle-headed arrow and a bar-headed arrow, respectively.
Using the process diagram, large scale molecular interaction process map with the size of approximately 600 components and interactions have been developed which demonstrates scalability of the notation (Kitano, Oda et al. 2004; Oda, Kimura et al. 2004).
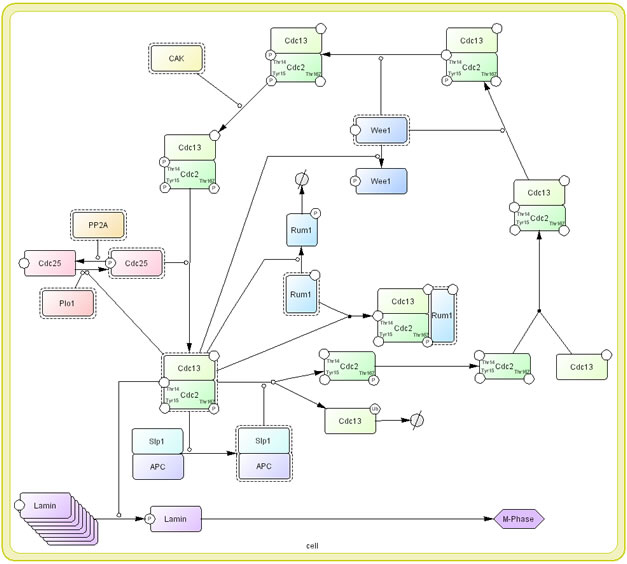
Fig 3: A process diagram representation of MPF cycle click for bigger image
>> Check Abbreviations
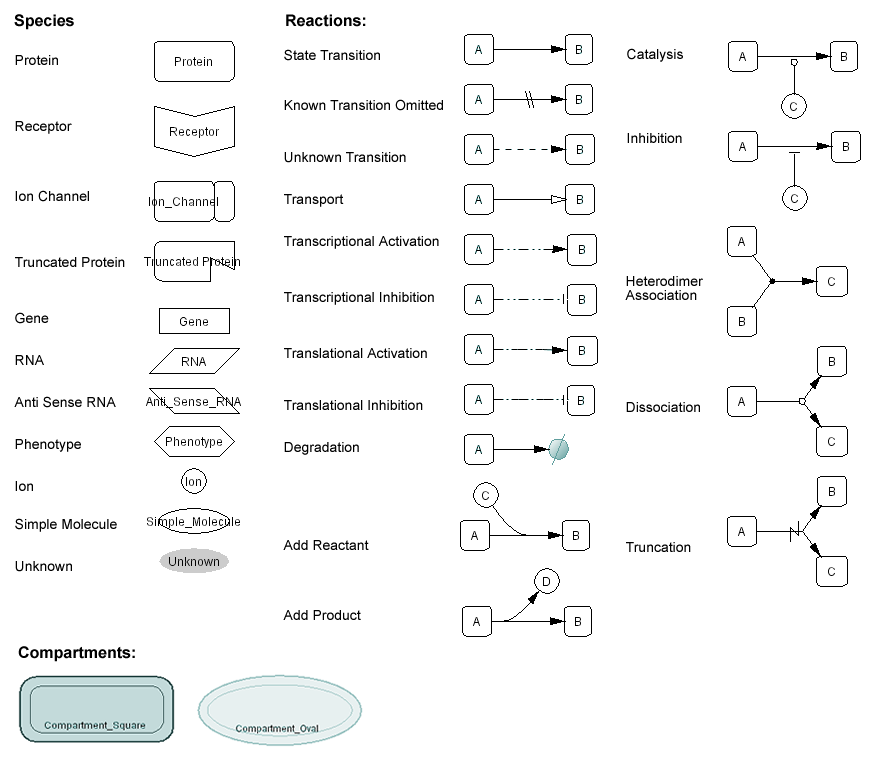
3 Diagram Legends
The symbols used to represent molecules and interactions are shown in Fig. 3. Each round-cornered box represents a specific state of a molecular species. The closed arrows (arrow head filled) represent changes in the state of modification (or allostericity), rather than indicating activation (as in Fig. 1). The schema avoids using symbols that directly point to the molecule to indicate activation and inhibition. Instead, the diagram directly indicates a transition from an inactive to an active state for activation, and a transition from an active state to an inactive state for inhibition. When these transitions are promoted or inhibited by other mediating molecules, such as active kinases, these reactions are represented by circle-headed lines for activation and bar-headed lines for inhibition, respectively. An open arrow (arrow head not filled) indicates the translocation of a molecule.
Fig. 4, 5, 6 indicate symbols used in the process diagram that is now employed in CellDesigner 2.0 (Funahashi and Kitano 2003).

Fig. 4. Main symbols adopted by the CellDesigner’s Process Diagram click for bigger image
Fig. 5. Expressions of the inner structures and the states
Fig. 6. Residue modification
4. Simple Examples
A couple of simple examples would help readers to understand how to create the process diagram. First, interaction involved in guanine nucleotide binding protein (G protein) is shown in Fig 7. In this diagram dissociation and reassociation of G protein heterotrimers composed of α-, β-, γ-subunits is represented. β2-agonist ligand binding to β2-adrenoreceptor (β2-AR) which is a kind of G-protein coupled receptor (GPCR) triggers the exchange of GTP for GDP on the αs-subunit, resulting in dissociation of αs-subunit from βγ complex. This process is described as active β2-AR catalysis (using a circle headed arrow) dissociation of GDP from Gαs, association of GTP with Gαs, and dissociation of αs-GTP and βγ complex. Dissociated αs-GTP and βγ complex exhibit the ability to interact with distinct effectors, such as adenylate cyclase, (shown as dashed line around the rounded-corner box for Gαs and Gβγ) leading a series of downstream signal transduction pathways. Gαs, however, has intrinsic GTPase activity which hydrolyzes GTP to GDP on the Gαs, (shown as circle headed arrow from Gαs) so that Gαs is deactivated and inactive Gαsβγ complex is reassembled (Wess 1997) (Johnson 1998). Other proteins, such as regulator of G-protein signalling (RGS) and β adrenergic receptor kinase (βARK), are also involved in this process, but they are not shown in the Fig. 7 for the sake of simplicity. Details of such activation and dissociation cannot be described properly in informal diagrams.
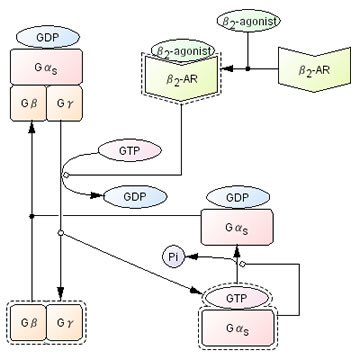
Fig 7. An example of the process diagram for G-Protein interactions
>> Check Abbreviations
Second example shown in Fig. 8 is NF-κB related interaction. NF-κB is a dimeric transcription factor and this diagram shows NF-κB signaling by prototypical p65/p50 heterodimer. NF-κB p65/p50 is retained inactive by its association with IκBα, an inhibitor of NF-κB, and PKAc, a catalytic subunit of protein kinase A. Ser32 and Ser36 residues of IκBα are phosphorylated by IKKαβγ complex activated by NIK, which causes nuclear translocation of the NF-κB complex. Translocation is shown using an open arrow. Lys21 and Lys22 residues on IκBα are polyubiquitinated by SCFβ-TrCP (a RING E3 protein composed of β-TrCP, Skp1, Cul1, and RING protein Roc1) and E2 ubiquitin-conjugating enzyme UbcH5, which causes nuclear export of the complex and dissociation of IκBα followed proteasomal degradation (Ben-Neriah 2002). This results in restoration of PKAc kinase activity to phosphorylate NF-κB Ser276 residue and phosphorylation of Ser529 residue by CKII, which dramatically increases the transcriptional activity of NF-κB and causes homodimerization. Then activated homodimer NF-κB is translocated into nucleus and initiates transcription of target genes, such as IκBα and p50 (McKay and Cidlowski 1999; Ghosh and Karin 2002).
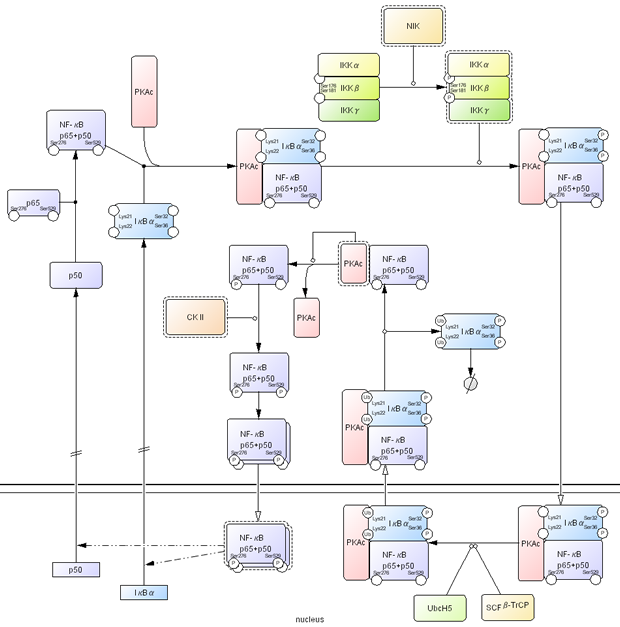
Fig 8. An example of NFkB related interactions click for bigger image
>> Check Abbreviations
5. Future Extensions: Redefinition of Transcription, Translation Processes and Hierarchical Complex Representation
The problem of current process diagram is that transcription and translation processes are not well defined. While the diagram is defined as state transition diagram, transcription and translation processes use arrows as transcriptional activation and translational activation that is not consistent with other part of the diagram. In the future release of CellDesigner (expected in Version 2.5), the process diagram notation is extended and redefined to enhance representation capability for transcription and translation processes.
5.1 Transcription and Translation Processes
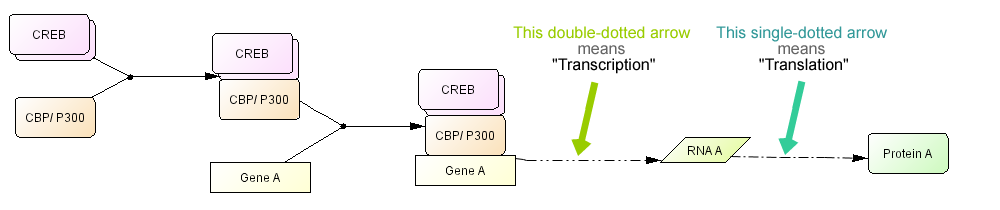
For a simple description of transcription, genes are represented as simple rectangular boxes and transcription factors and other regulatory factors bind to the box. A dashed arrow that represents transcription process is used to indicate RNA is transcribed from the sequence and RNA translated into protein (Fig. 9). Transcription and translation processes are represented with special arrows that should represents complex processes behind it.
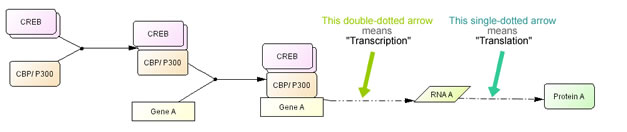
Fig. 9. A simple example of a CREB driven transcription process click for bigger image
>> Check Abbreviations
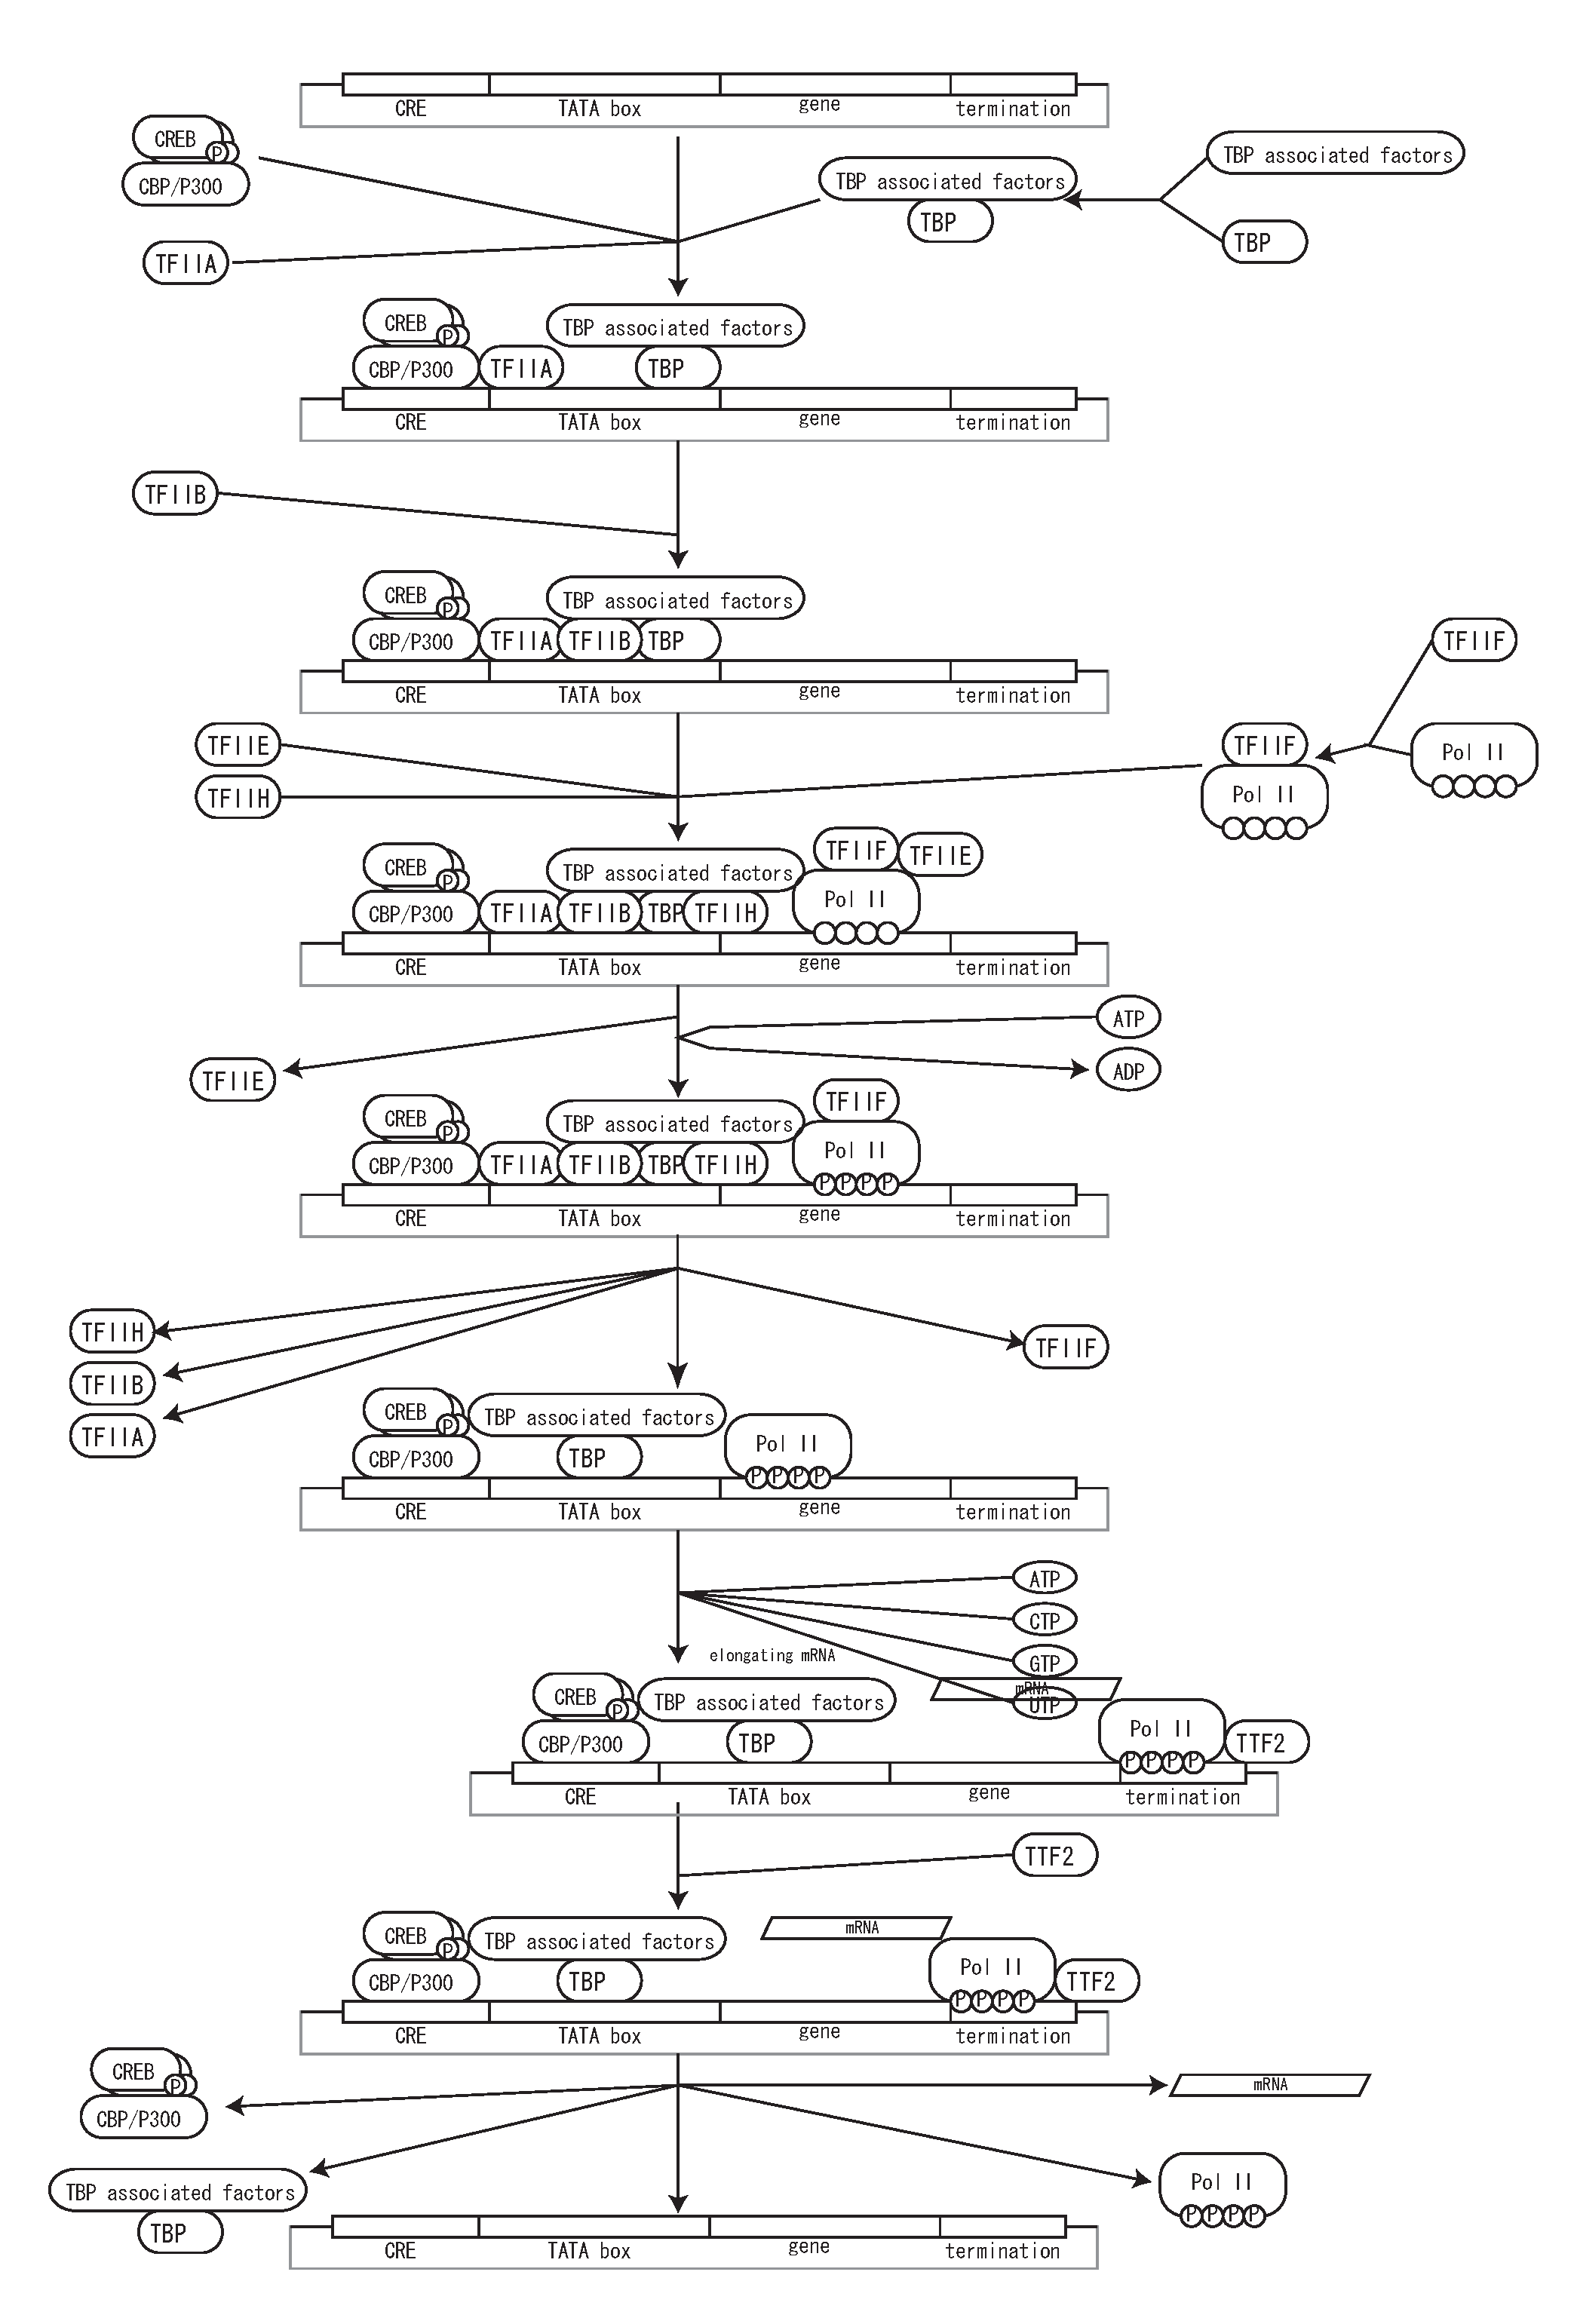
Fig.10 represents more detail of this process. As a state transition diagram transcription shall be described as transition of nucleotides into RNA, and translation shall be transition of amino acid into protein. Fig.10 explicitly represent these processes. However, in many cases, such processes do not need to be explicitly represented, so that we will define dedicated symbols for simplify the user’s work, as seen in Fig. 9. Specific symbols for transcription and translation will be defined by the time of CellDesigner 2.5 release.
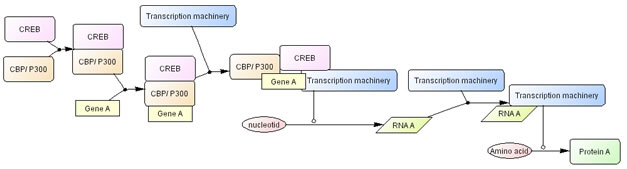
Fig. 10. CREB driven transcription process with transcription machinery represented click for bigger image
>> Check Abbreviations
5. 2 Promoter Structure Representations
A new extension allows user to define structure of promoter region, exon, and histones. Specific promoter regions, exon, and histone are represented on upper part of the box (Fig. 11). When such structure information is defined, lines for both sides and lower part of the box are either not shown or dimmed to highlight structures represented on the upper line.
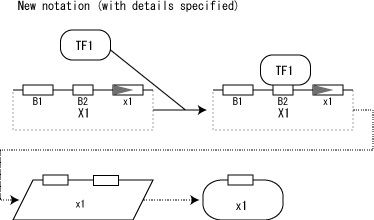
Fig.11. New notation for transcription and translation
Fig. 12(a) indicates a set of new symbols for transcription, and Fig. 12(b) shows how it may be used.
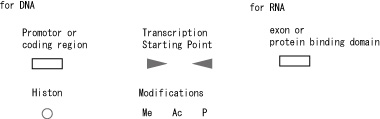
Fig. 12(a). Symbols related to transcription and translation
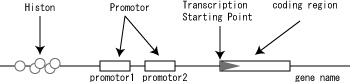
Fig.12(b). A usage example transcription related symbols
With using detailed notation for promoter region, detailed state transition for transcription can be described. Fig. 13 shows example of state transition of transcription factor bindings and a transcription process.
Fig. 13. A process of transcription in the process diagram
5.3 RNA
RNA is represented in a slanted box. When exon structure is represented, exons are represented on the upper line (Fig. 14).
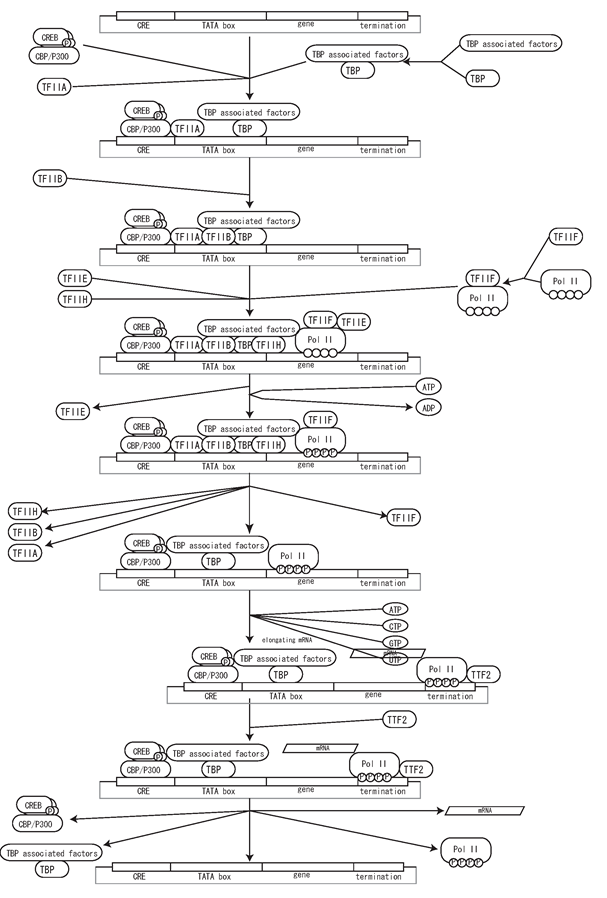
Fig. 14. Representation of exon structure of RNA click for bigger image
Alternative splicing can be represented as transition of RNA from original state to multiple RNA with different splicing patterns (Fig. 15).
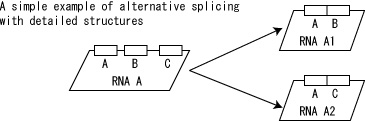
Fig.15. Alternative splicing example
5.4 Hierarchical Complex Representation
Current notation describe complex as simple association of multiple protein symbols. However, this is not convenient when complex itself has distinct name. For example, NF-κB is a heterodimer of p65 and p50. Current notation can only represent NF-κB as one elementary protein or as a complex of p65 and p50 without naming then as NF-κB. Practical compromise is to name each subunit as NF-κB (p65) and NF-κB (p50), but far from satisfactory. Many receptors are complex of subunits each has its own name, so that this complex naming is a major problem is proper and convenient description. In order to solve this problem, hierarchical complex representation will be introduced that enables users to name both subunits and complex. Fig. 16 shows examples of such complex description.
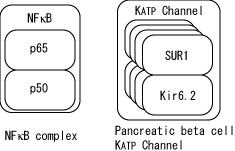
Fig. 16. Examples of Hierarchical complex description
>> Check Abbreviations
6. Final Remarks
Graphical notations described in this document have been implemented in CellDesigner 2.0, and extensions specified will be implemented in CellDesigner 2.5 that will be released in 2005. We recognize that there are numbers of improvements needed to fully describe biological processes. Thus, we would like to welcome comments and suggestions for improving graphical notations and CellDesigner software. Our hope is to contribute to the community by offering possible standard set of graphical notations that are powerful, software supported, and mathematically transportable.
REFERENCES
- Ben-Neriah, Y. (2002). "Regulatory functions of ubiquitination in the immune system." Nat Immunol 3(1): 20-6.
- Cook, D. L., J. F. Farley, et al. (2001). "A basis for a visual language for describing, archiving and analyzing functional models of complex biological systems." Genome Biol 2(4): RESEARCH0012.
- Den Haese, G. J., N. Walworth, et al. (1995). "The Wee1 protein kinase regulates T14 phosphorylation of fission yeast Cdc2." Mol Biol Cell 6(4): 371-85.
- Fleig, U. N. and K. L. Gould (1991). "Regulation of cdc2 activity in Schizosaccharomyces pombe: the role of phosphorylation." Semin Cell Biol 2(4): 195-204.
- Funahashi, A. and H. Kitano (2003). "CellDesigner: a process diagram editor for gene-regulatory and biochemical networks." Biosilico 1(5): 159-162.
- Ghosh, S. and M. Karin (2002). "Missing pieces in the NF-kappaB puzzle." Cell 109 Suppl: S81-96.
- Gould, K. L., S. Moreno, et al. (1991). "Phosphorylation at Thr167 is required for Schizosaccharomyces pombe p34cdc2 function." Embo J 10(11): 3297-309.
- Johnson, M. (1998). "The beta-adrenoceptor." Am J Respir Crit Care Med 158(5 Pt 3): S146-53.
- Kitano, H. (2003). "A graphical notation for biochemical networks." BioSilico 1(5): 169-76.
- Kitano, H., K. Oda, et al. (2004). "Metabolic syndrome and robustness tradeoffs." Diabetes 53 Suppl 3: S6-S15.
- Kohn, K. W. (1999). "Molecular interaction map of the mammalian cell cycle control and DNA repair systems." Mol Biol Cell 10(8): 2703-34.
- Kohn, K. W. (2001). "Molecular interaction maps as information organizers and simulation guides." Chaos 11(1): 84-97.
- Maimon, R. and S. Browning (2001). Diagramatic Notation and Computational Structure of Gene Networks. Proceedings of the Second International Conference on Systems Biology. H. Kitano. Madison, WI, Omnipress: 311-7.
- McKay, L. I. and J. A. Cidlowski (1999). "Molecular control of immune/inflammatory responses: interactions between nuclear factor-kappa B and steroid receptor-signaling pathways." Endocr Rev 20(4): 435-59.
- Oda, K., T. Kimura, et al. (2004). "Molecular Interaction Map of a Macrophage." AfCS Research Reports 2(14 DA): 1-12.
- Pirson, I., N. Fortemaison, et al. (2000). "The visual display of regulatory information and networks." Trends Cell Biol 10(10): 404-8.
- Sveiczer, A., J. J. Tyson, et al. (2004). "Modelling the fission yeast cell cycle." Brief Funct Genomic Proteomic 2(4): 298-307.
- Wess, J. (1997). "G-protein-coupled receptors: molecular mechanisms involved in receptor activation and selectivity of G-protein recognition." Faseb J 11(5): 346-54.