To convert the graph to a scatter plot:
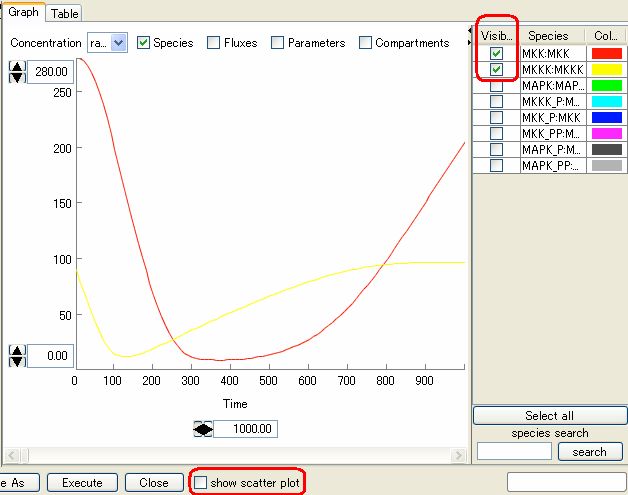
- In the ControlPanel, select any two Species by ticking the checkboxes in the Visible column.
- Observe that the graph has been reduced to two curves.
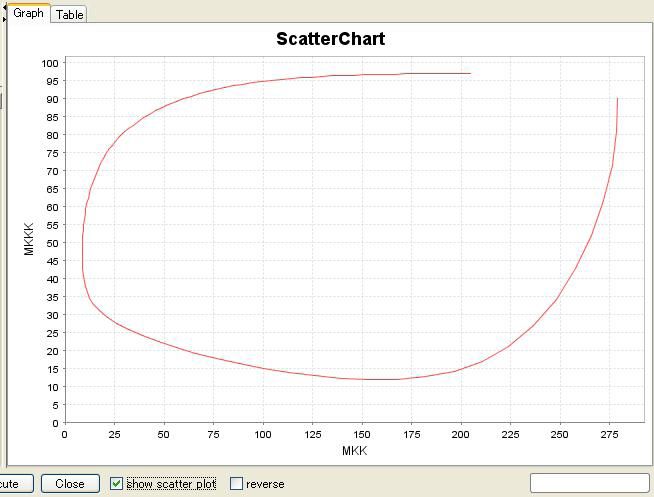
- Tick the show scatter plot checkbox.
- Observe that in the new graph the x-axis does not indicate time series any more.
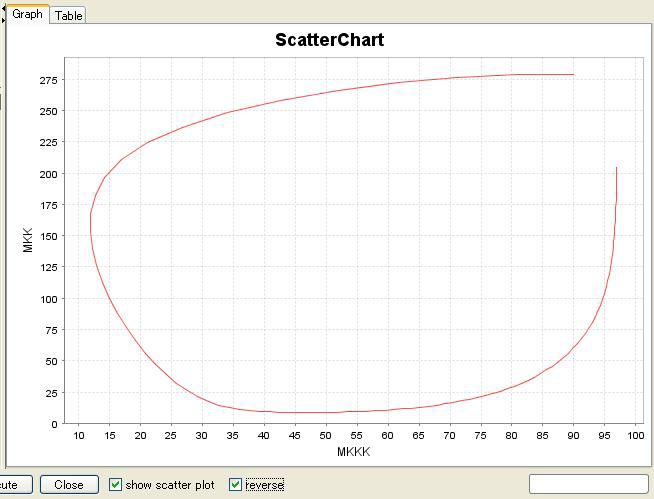
- Select the reverse checkbox to change the x- and y- axes.