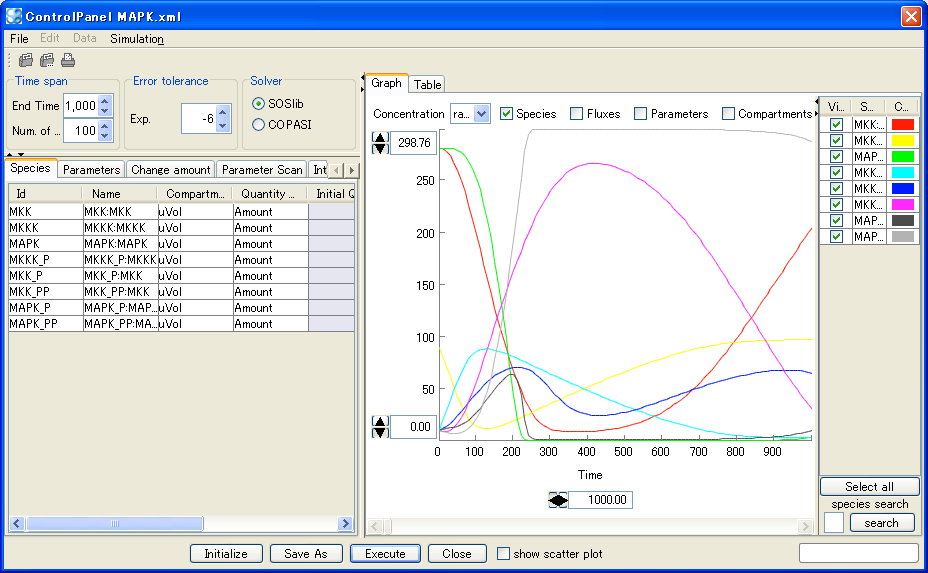
Simulation using the ControlPanel
To simulate a model using the ControlPanel
- Open the sample file "MAPK.xml" in the "samples" folder.
- In the Menu, select Simulation - ControlPanel.
- ControlPanel will open.
- Change the End Time value to "1000".
- Click Execute button.
- You will see the time course plot in the right side of the ControlPanel.
To change the solver to COPASI (or SBML Simulation Core library)
- In the ControlPanel, click the COPASI radio button.
- Click Execute.
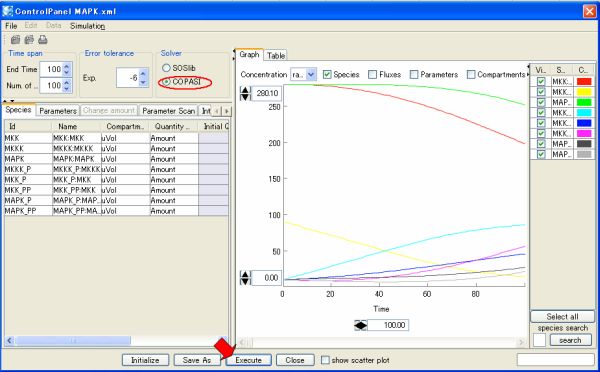
You can select SBML Simulation Core Library as Solver.
To convert the graph to a scatter plot
- In the ControlPanel, select any two Species by ticking the checkboxes in the Visible column.
- Observe that the graph has been reduced to two curves.
- Tick the show scatter plot checkbox.
- Observe that in the new graph the x-axis does not indicate time series any more.
- Select the reverse checkbox to change the x- and y- axes.
