CellDesigner Help

"Mapping Array Mass" plugin

This plugin can be used to display on a CellDesigner model the expression level of genes and proteins by microarray and mass spectrography.

The file "MappingArrayMass_plugin.jar" is supposed to be copied in "\plugin\" folder of your CellDesigner installed directory during the installation.

To create an input file

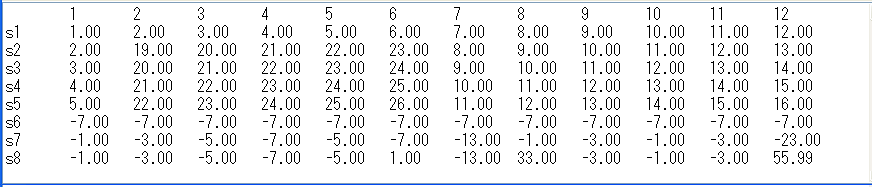
  1. Create a list of Species IDs and expression level (numerical), and save it in a file.
  2. The list should be a table with the Species IDs in rows and the Time in columns. Each value should be separated by tabs.
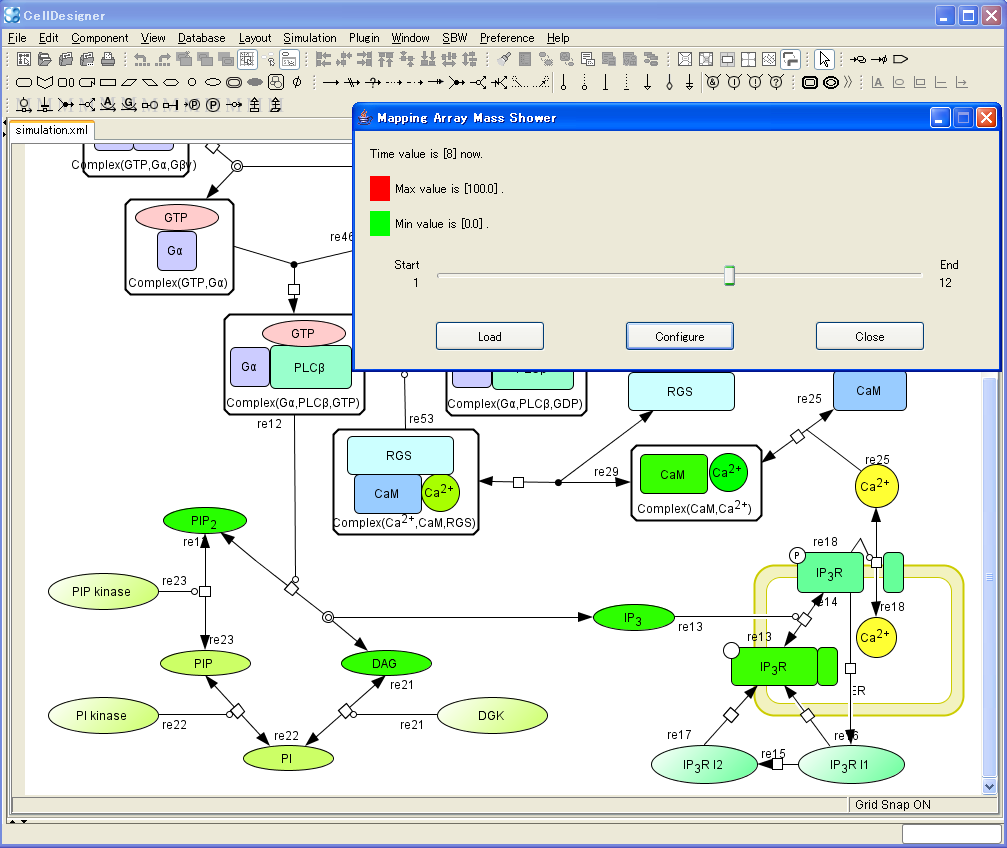
To display

  1. Launch CellDesigner.
  2. Open a model.
  3. In the Menu, click Plugin, select MappingArrayMass..., then Show result.
  4. In the Pattern select dialog, select options and click OK.
  5. Information dialog opens.
  6. Click OK.
  7. In the Open dialog, select the file which contains the list of Species IDs and expression level. The list has been created in the procedure described above.
  8. In the Mapping Array Mass Shower dialog, drag the slider knob or click on the slider.
  9. The color of the Species will change according to the values set in the "Species IDs and expression level" list.

To set "Value & Color"

  1. In the Mapping Array Mass Shower dialog, click Configure.
  2. Set Max/Min Value.
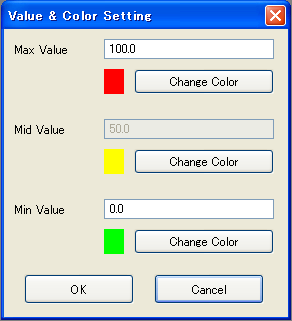
  3. Mid Value will be automatically calculated according to the Max and Min Value.

  4. Set colors for Max/Min Value.
  5. Click OK.
  6. If the expression level exceeds Max Value, the color specified for Max Value will be displayed.
    If the expression level exceeds Min Value, the color specified for Min Value will be displayed.
    If the expression level is between Min Value and Max Value, colors will be graded according to the expression level.

To load another file

  1. In the Mapping Array Mass Shower dialog, click Load.
  2. In the Open dialog, select another file.
About Us | Site Map | Privacy Policy | Contact Us | ©2010 The Systems Biology Institute All Rights Reserved.